Chapter 9 Results
9.1 Implementation methodology
Implementing the Pipeline Digital Twin (PDT) is a step-by-step process that covers data collection and structuring, model development, and integration of those models into management and operational workflows. The methodology follows a phased approach, which lets us tailor the system to the specifics of each asset.
9.1.1 Stage 1. Data analysis
Collecting and analyzing technical documentation
Design documentation:
- general data;
- plan and profile;
- pipes and the requirements for connecting parts, shut-off valves, and control valves.
As-built documentation:
- working drawings;
- certificates (specifications) for the installed pipes, connecting parts, shut-off valves, and control valves;
- welding log.
Operating documentation:
- pipeline process-mode data: pressure (inlet/outlet), temperature (inlet/outlet);
- results of the diagnostics performed;
- data on failures (accidents/leaks) and repairs across the entire service life.
9.1.2 Stage 2. Building the geotechnical digital model
Building the element database
- Pipes, connecting parts, welded joints, and structural elements.
- Element dimensions, locations, materials (GOST, technical specifications), and installation dates.
- When information is missing, we assume the worst case for strength and durability.
Structuring the data
From the documents (data sheets, schematics, standards), we build an element log:
- element position number on the schematic;
- standard for the pipe/part/valve;
- standard for the material;
- spatial coordinates of the element start (X, Y, Z);
- spatial coordinates of the element end (X, Y, Z).
Creating the spatial (3D) model
Based on the database we build, we construct a digital model of the pipeline and add welded joints, branches, and supports.
Figure 13 — Digitizing and building the 3D model of the pipeline
9.1.3 Effectiveness of 3D modeling
Modeling speed
The most important result for the customer is a 3D model of the pipeline with a detailed breakdown by element, coordinates, and steel composition. Traditional 3D modeling of a long pipeline usually takes months; the PDT stand completes this task in 3-4 days.
Practical case: refinery
One oil refinery received a PDT report that flagged hazardous zones, but it ignored the recommendations and buried the document. Six months later, a fire broke out at the plant in exactly the spot the report had marked as a critical section. This case shows the practical value of spotting stress-concentration zones early and prioritizing repairs.
9.1.4 Stage 3. Infrasonic instrument monitoring
Purpose of monitoring
To measure the dynamic characteristics and parameters of the pipeline, along with the actual loads and external influences.
Setting up the monitoring
- Infrasonic monitoring uses instruments that record linear accelerations and angular velocities in three directions.
- We determine the amplitude-frequency characteristics of the pipeline’s vibrations, displacements, and rotation angles.
Instrument placement points
- We recommend placing instruments at branches (flanged tees), pipeline ends, and shut-off valves.
- Sections without thermal insulation and with easy access are preferred.
9.1.5 Stage 4. Solving the set of dynamic problems
Calculating displacements and forces
- Distribution of displacements and forces across the pipeline elements.
- Identification of zones with heightened stress concentration.
Calculating the stress-strain state
The key risk factor is not so much corrosion damage as operating loads. The greatest hazard comes from stress-concentration zones, which are set by how the pipeline is anchored and how it operates. These zones are where critical defects most likely develop. When no significant loads are present, an emergency requires corrosion to break all the way through the wall, which is far less likely and plays out over a much longer horizon.
We treat the section as a spatial bending frame made of straight and curved spans. The calculation covers:
- forced dynamic vibrations (frequency range 0.000001-100 Hz);
- deformations from the weight of the pipeline and the product;
- deformations from temperature swings;
- deformations from pressure changes;
- hoop, longitudinal, and shear stresses.
Identifying the causes of out-of-spec stresses
- High cyclicity of internal pressure.
- Actual external loads exceeding the design values.
- Deviations from the design solutions during construction.
- Shifts in plan and elevation position during operation.
9.1.6 Stage 5. Calculating residual life
Failure probability
From the stress-strain state and the mechanical properties of the metal, we determine the failure probability of each element, accounting for the stochastic nature of the loads.
Total failure rate
We sum it across all load types (static and dynamic). We determine the uncertainty bound at a confidence level (for example, 90 %).
Determining the safe service period
We use standards (for example, RD-23.040.00-KTN-115-11 by Transneft), adapted for process pipelines with infrasonic monitoring.
Ranking the elements
- Unacceptable risk: operation at design modes is impossible until the fault is fixed;
- Period < time to the next inspection: repairs must be completed in advance;
- Period > time to the next inspection: repair is not warranted before the next diagnostics.
9.1.7 Stage 6. Analyzing results and making recommendations
List of compensating measures
- Fixing pipe defects.
- Restoring pipeline supports and anchors.
- Reinforcing or restoring corrosion-protection equipment.
- Engineering protection (reinforcing the structure).
- A combination of the measures above.
Building repair programs
- Safe service periods.
- Scope, volume, and methods of the compensating measures.
- Exclusion from short-term repair plans of elements with a sufficient reliability margin.
9.2 Company experience
The staff at Digital Twin has more than 30 years of experience developing digital models and methodologies for monitoring, analyzing, assessing, and managing the technical condition of pipeline systems and tanks.
The company has delivered a number of successful projects aimed at reducing accident rates and improving the operating efficiency of infrastructure.
9.3 Platform users
The PDT platform is built to meet the needs of both industry organizations and the internal functional services of enterprises that work with pipeline infrastructure.
Figure 14 — Overview of the PDT platform web interface
9.3.1 Industry users
Water utilities, heating networks, and municipal utilities
They use the platform to create 3D models, run comprehensive diagnostics, calculate the strength of water-supply and sewer networks, and plan preventive maintenance.
Gas services
They use the digital twin to pinpoint the condition and wear of gas pipelines, build detailed repair plans, and prevent emergencies.
Industrial enterprises (continuous-cycle plants)
They use the platform to inspect pipeline systems for durability, identify hazardous sections, and prepare investment programs for repair, reconstruction, and modernization.
Designers and builders
For new projects, the platform builds spatial models of pipelines, runs load calculations, and develops repair-measure plans.
9.3.2 Functional services within enterprises
Operations services
These services handle the day-to-day management and monitoring of the pipeline’s technical condition. The platform lets them visualize data, catch deviations quickly, and prevent emergencies.
Planning and repair services
They use digital models and calculation data to build well-grounded programs for capital and routine repairs that reflect real operating parameters.
Diagnostic services
They use the platform to analyze the results of infrasonic instrument monitoring, calibrate the diagnostic model, and accurately estimate residual life.
Financial services and investors
They rely on accurate calculations, failure forecasts, and effectiveness assessments to justify costs, control repair profitability, and make investment decisions.
9.4 Application examples
9.4.1 Oil-transport companies
Applying the PDT to monitor trunk oil pipelines made it possible to:
- identify sections with an out-of-spec stress-strain state;
- determine the causes of accelerated wear (non-design dynamic loads);
- build a targeted repair program instead of a wholesale replacement.
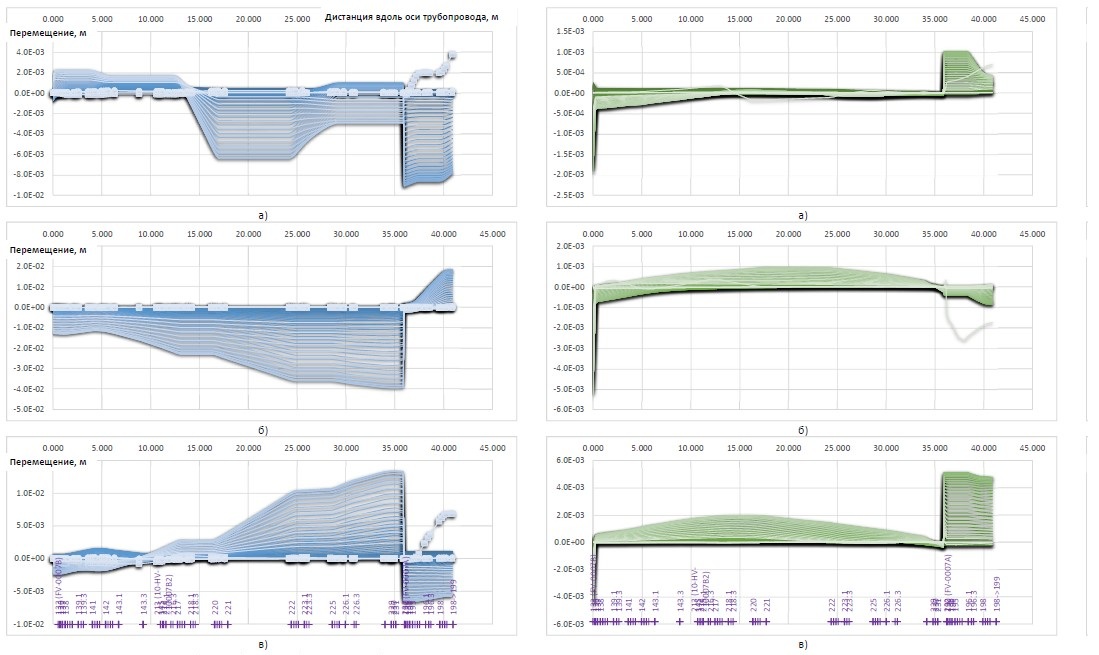
Figure 15 — Distribution of displacements and rotation angles of pipeline elements
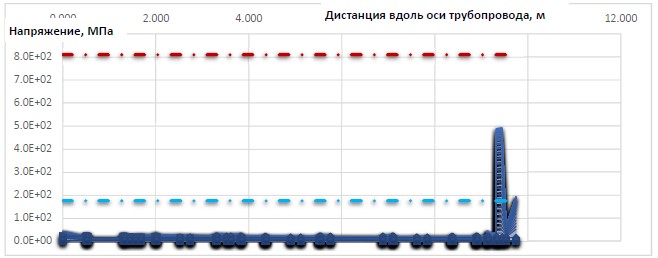
Figure 16 — Strength calculation: stress distribution along the pipeline axis
9.4.2 Water utilities
Deploying the platform on water-supply networks delivered:
- a 3D model of the network linked to diagnostic data;
- ranking of sections by residual life;
- a shift from emergency to planned repairs, cutting costs by 40-60 %.
9.4.3 Industrial enterprises
For process pipelines in continuous production:
- Infrasonic monitoring identified sections with critical dynamic loads.
- Residual-life calculations made it possible to justifiably extend operation by 5-10 years.
- The repair investment program was optimized based on the digital twin’s data.