Chapter 5 General architecture of the platform
5.1 Overview
The Pipeline Digital Twin (PDT) platform is a multi-tier client-server system that manages the full pipeline infrastructure cycle — from data collection to management decisions.
The platform architecture rests on these principles:
- Modularity. Each functional block runs and updates independently.
- Scalability. The system adapts to the size of the infrastructure it serves.
- Integrability. Open interfaces let you connect external data sources.
- Security. Access control and data protection keep work with engineering and operational information under control.
A high-level diagram of the platform’s source data and computation flows shows how information from external sources (isometric drawings, elevation data, materials, loads, infrasonic monitoring results, and defect records) turns into the key digital twin artifacts — the element registry, 3D and 4D pipeline models, stress-strain state (SSS) calculations, and strength and durability reports — and then feeds into diagnostics, protection, repair, and monitoring programs.
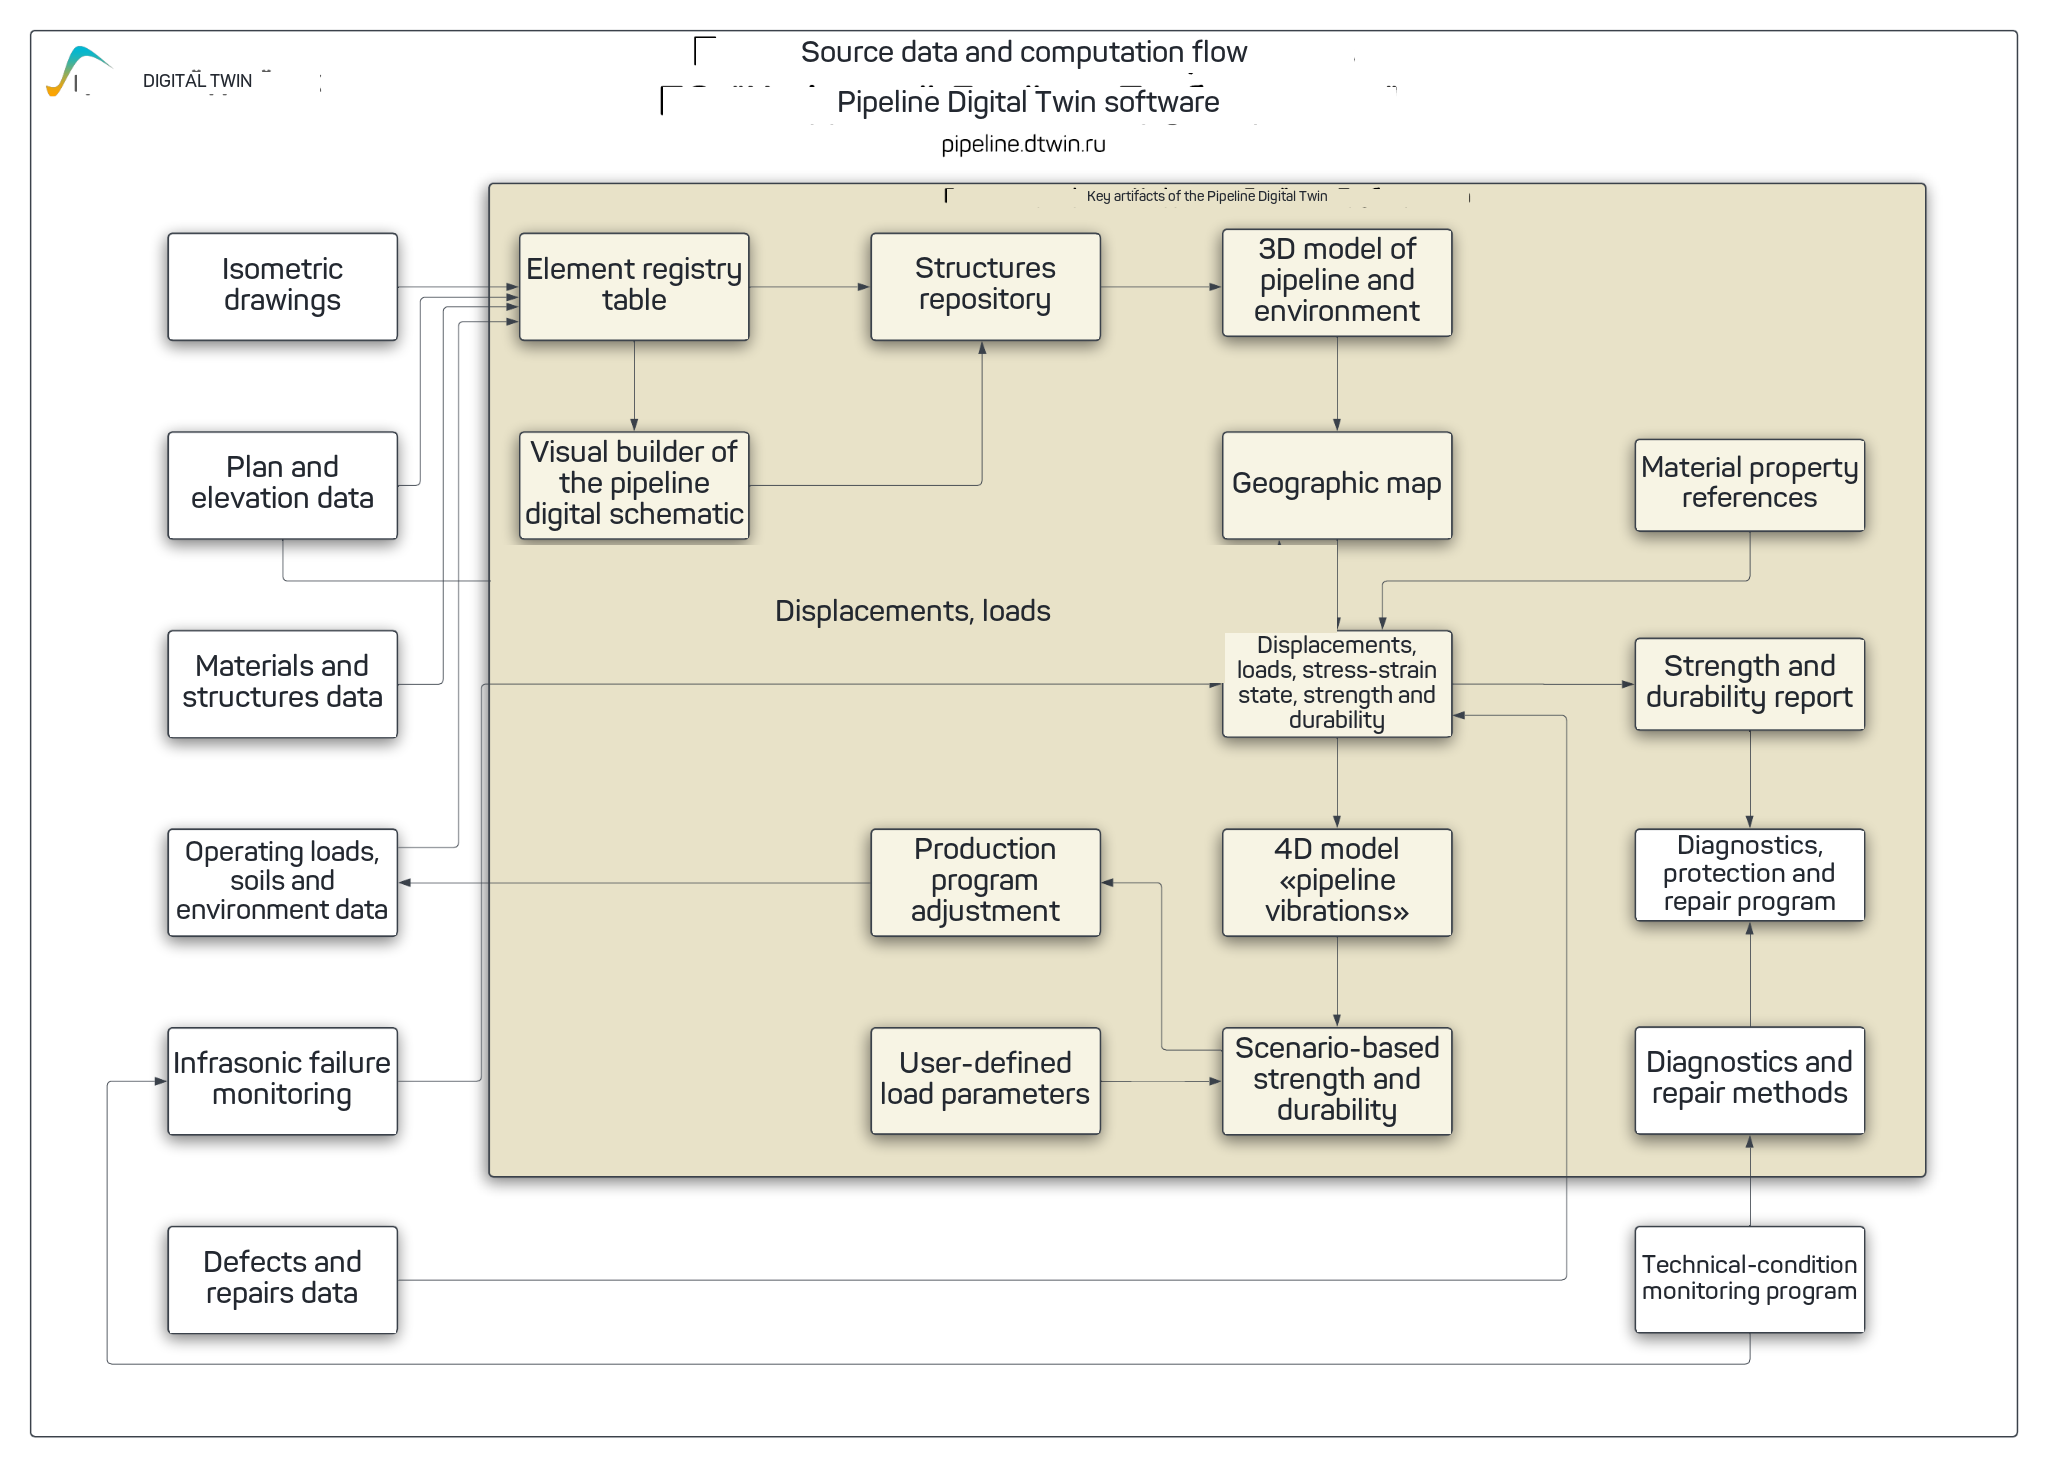
Figure 5 — Source data and computation flow of the Pipeline Digital Twin platform
5.2 Architecture layers
The platform architecture splits into several functional layers. This separation keeps data storage, engineering calculations, analytics, and the user-facing view apart while preserving the integrity of the whole system.
5.2.1 Data layer
The data layer forms the platform’s single information foundation. It consolidates information about pipeline elements, diagnostic results, measurements, repairs, and operational parameters.
The centralized database holds:
- a log of pipeline elements (pipes, parts, fittings, welded joints, supports);
- diagnostic survey results;
- measurement data from infrasonic instruments;
- repair history and operational parameters.
5.2.2 Modeling layer
The modeling layer builds the digital representation of the pipeline system and runs engineering calculations. It ties together the object’s geometry, actual diagnostic data, and the physical and mathematical models needed to assess condition and life.
The modeling layer includes:
- 3D constructor. A visual editor for building spatial pipeline models that accounts for elements, diameters, lengths, materials, directions, and branches.
- Skeleton. A connectivity matrix of pipeline segments that defines the system of equations for the calculations. It builds the structure for the downstream computation of forces, displacements, and Krylov matrices.
- Computation module. A separate computation job written in C++ that solves the systems of equations for forces and displacements. The calculations run on the Targets platform.
- Prediction module. Probabilistic analysis of failures and residual life based on the modeling results.
5.2.3 Technology stack
The PDT platform runs on the following technology stack:
- R — the user-facing web interface, chart visualization through Plotly, and data processing.
- C++ — the computation module that solves systems of equations and computes the stress-strain state.
- File storage — data lives in files, with no database. Reference tables sit in flat files, and projects sit in Excel format.
This layer handles:
- Scenario modeling (“what-if” analysis).
- Ranking elements by repair priority.
- Building maintenance and repair (MRO) programs.
- Generating reports and visualizing results.
5.2.4 Presentation layer
The presentation layer gives users access to data, models, calculations, and analytical results. It serves technical specialists, engineering services, and managers through a convenient visual interface. The user-facing layer includes:
- A web interface for work through a browser.
- Interactive 3D visualization of the pipeline network.
- Monitoring panels and dashboards.
- Report export in various formats.
5.3 Technology stack
The platform’s technology stack fits the needs of engineering modeling, web access, historical data storage, and integration with diagnostic equipment. It ensures reproducible calculations, extensible functional modules, and the option to deploy the platform across different operational environments.
| Component | Technology |
|---|---|
| Server platform | R lang, open source (GPL-3 license) |
| Web interface | Interactive web client |
| 3D visualization | Spatial modeling in the browser |
| Database | Centralized storage with historical analysis |
| Computation module | Physical and mathematical models of strength and durability |
| Diagnostics | Integration with infrasonic monitoring instruments |
5.4 Hardware requirements
Hardware requirements depend on the platform’s operating mode, the number of users, and the volume of data processed. The figures below are rough parameters for deploying the system across three environments: production, test, and development.
5.4.1 Server hardware (up to 50 users)
| Spec | Production (prod) | Test (test) | Development (dev) |
|---|---|---|---|
| Processor, GHz | 4 | 3 | 3 |
| Processor cores | 8 | 8 | 8 |
| RAM, GB | 32 | 32 | 32 |
| Hard drive, GB | 100 | 32 | 32 |
| Network adapter, Mbps | 200 | 100 | 100 |
5.4.2 User workstation
A user does not need a specialized engineering workstation. Access to the platform runs through a browser, so the main requirements concern the performance of the client device and comfortable work with visual interfaces.
| Spec | Minimum value |
|---|---|
| Processor, GHz | 2.2 |
| Processor cores | 4 |
| RAM, GB | 8 |
| Hard drive, GB | 10 |
| Monitor | 1920×1080 |
5.5 Access to the platform
You can use the PDT platform as a cloud service, which lets you quickly reach the demo stand and the product web page without a local deployment.
Available resources:
- Demo version: pipeline.dtwin.ru
- Product web page: dtwin.ru/saas_pipeline