Chapter 6 Functional architecture
The Pipeline Digital Twin (PDT) platform brings together scientific, methodological, hardware, and software solutions that tackle a wide range of tasks in assessing, monitoring, and optimizing pipeline infrastructure. The system’s functionality splits into two complementary layers: the tasks the platform handles as a complete solution, and the specific functions of the software.
6.1 What the platform can do
6.1.1 Digitization and reverse engineering
The platform lets you build 3D digital models of pipelines that account for complex topology, materials, and design features. You can do this through a convenient drag-and-drop builder or by uploading tabular data templates, which turns design, as-built, and operational documentation into machine-readable form.
6.1.2 Diagnostic data integration
The system combines data from a range of sources:
- in-line inspection results;
- infrasonic monitoring data;
- operating-parameter measurements;
- data on external loads and weather conditions.
This produces an enriched model of the pipeline.
6.1.3 Instrumental monitoring and calibration
Infrasonic and vibration-diagnostic instruments capture the pipeline’s dynamic characteristics (vibrations, deformations, rotation angles, and forces). This data calibrates the mathematical models that estimate the real dynamic loads acting on the structure.
6.1.4 Physical load calculation and modeling
The platform treats the pipeline as a spatial frame made up of straight and curved spans, and runs detailed calculations of:
- deformations and stresses (hoop, longitudinal, and shear);
- bending and torsional moments;
- residual life and durability;
- safe operating periods, accounting for the effects of weight, temperature, and pressure.
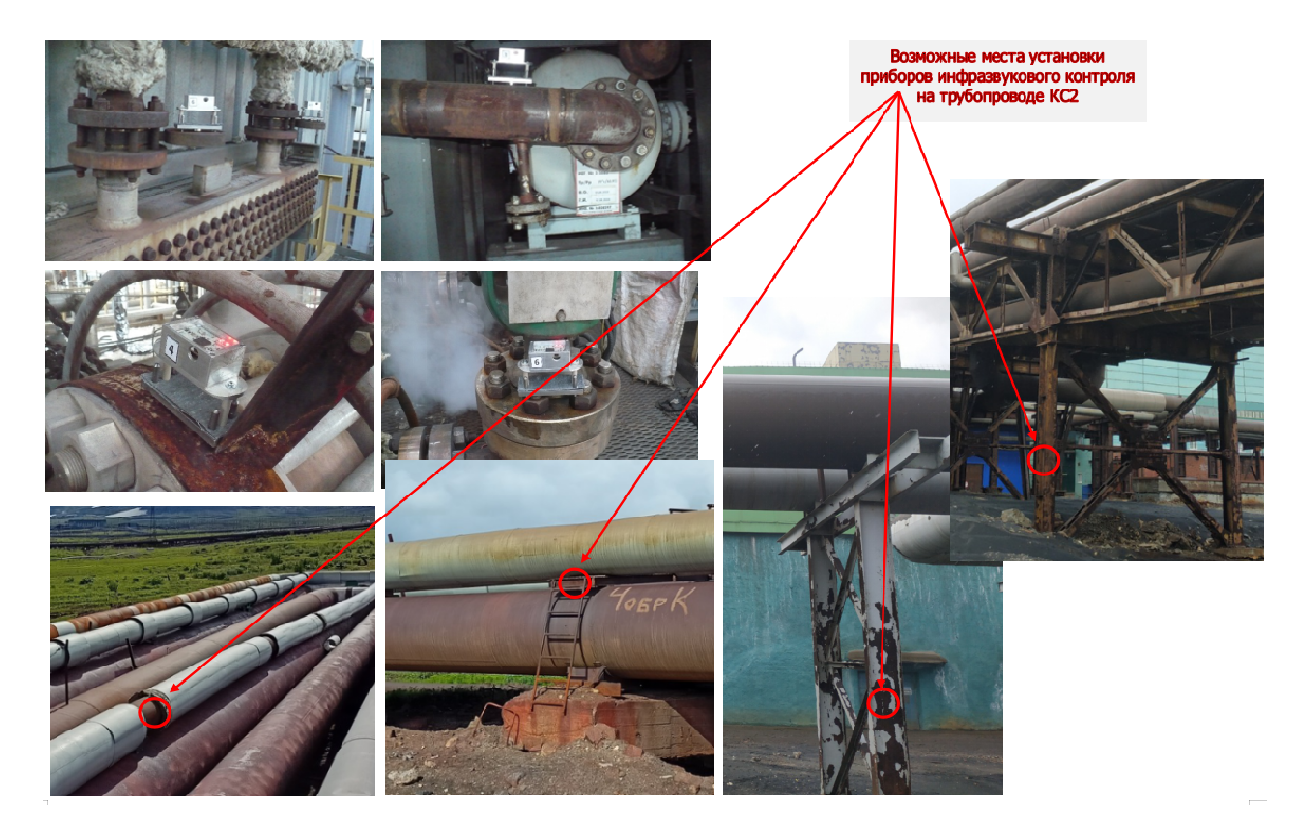
Figure 6 — 3D model of a pipeline with a visualization of the stress-strain state (SSS) calculation results
6.1.5 Pipeline failure factors
Under the PDT methodology, a pipeline typically fails when two of three key factors combine:
- Loads exceed code or design limits — the leading failure factor. Transverse loads (bending) pose the greatest danger, not internal pressure. Off-spec loading is determined by how the pipeline is anchored and how it is operated.
- Adverse defects — cracks and other structural damage not related to corrosion.
- Badly degraded material — degradation of the metal’s properties that lowers its strength characteristics.
The key risk factor is not so much the corrosion damage itself as the operating loads, especially in stress-concentration zones.
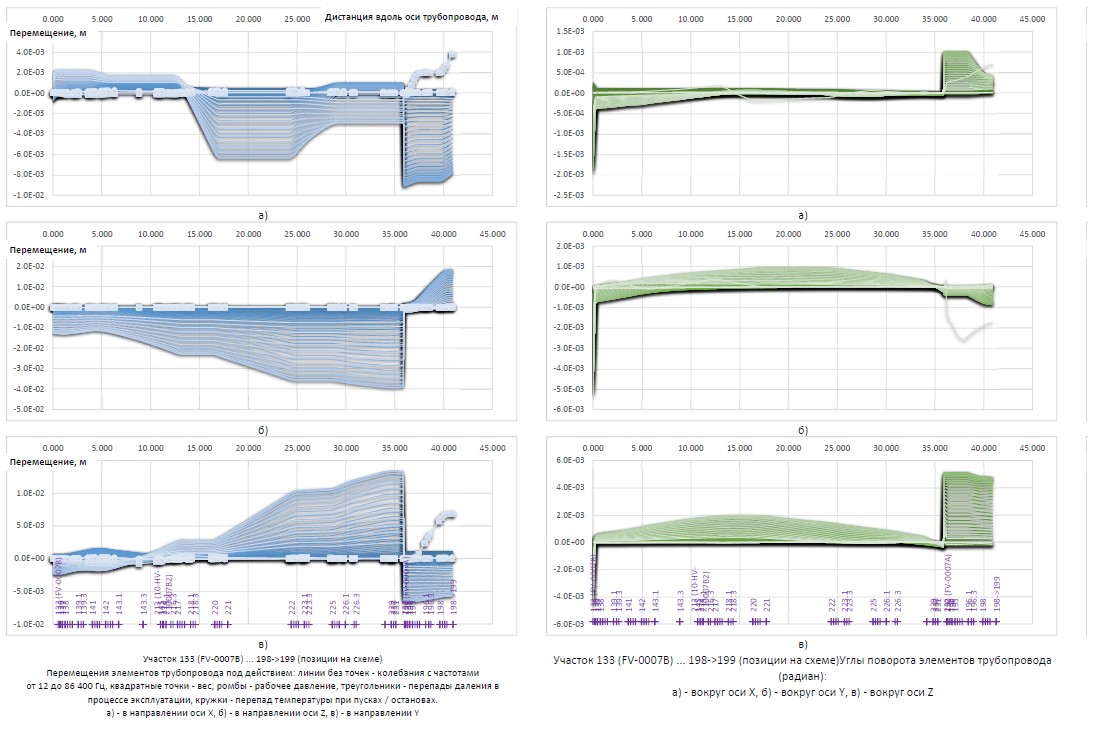
Figure 7 — Photograph of a pipeline at a Nornickel site
6.1.6 Failure prediction and operational optimization
Based on an integrated analysis of the pipeline’s condition, the system predicts potential failure sections and calculates the probability of failure. This lets you build well-grounded repair and preventive-maintenance programs.
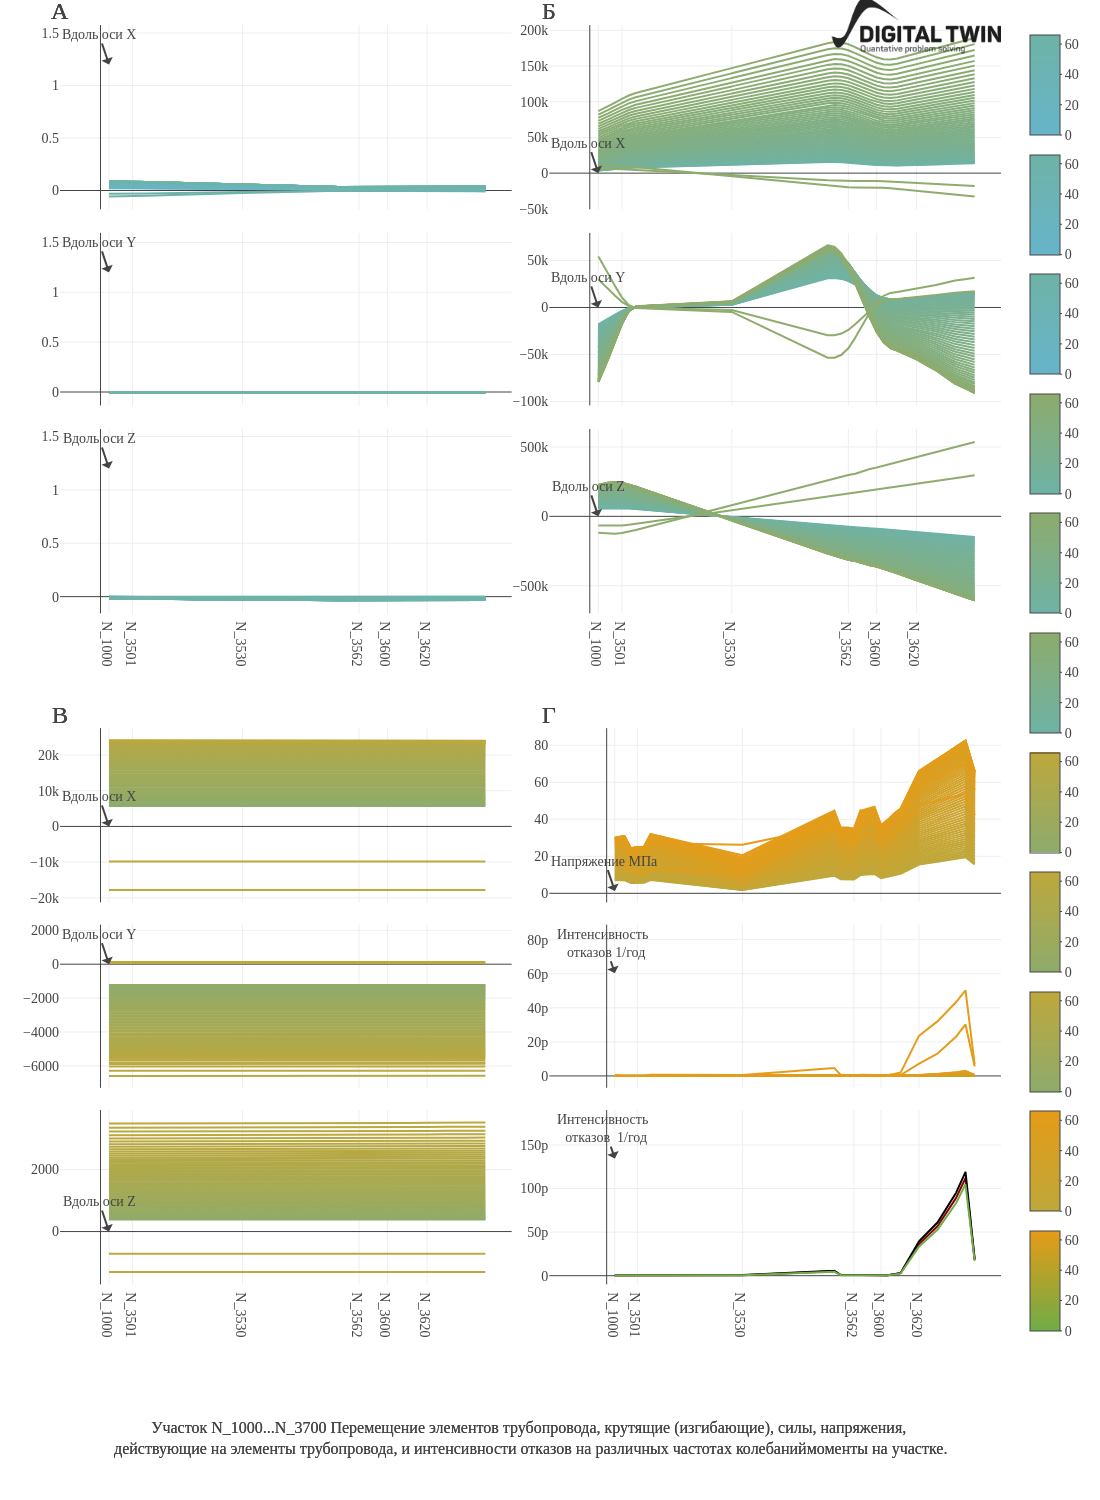
Figure 8 — Risk map and prioritization of repair work by pipeline element
6.2 PDT software functions
6.2.1 Digital model builder
A graphical interface for building a 3D pipeline model with drag-and-drop placement of elements. You can load data from tabular templates or enter it manually, which reproduces the design documentation accurately.
6.2.2 Measurement data integration
A module that connects data from infrasonic and vibration-diagnostic instruments and ties it to control points on the 3D model. This lets you calibrate the model against actual dynamic-load parameters.
6.2.3 Dynamic and static load calculation
Mathematical algorithms perform the physical calculation: they determine how loads distribute along the pipeline and compute the acting forces, bending moments, deformations, and stress-strain state, accounting for the material, defects, and engineering margins.
6.2.4 Residual life prediction
A module that assesses durability and remaining service life based on statistical data processing and modeling of damage kinetics.
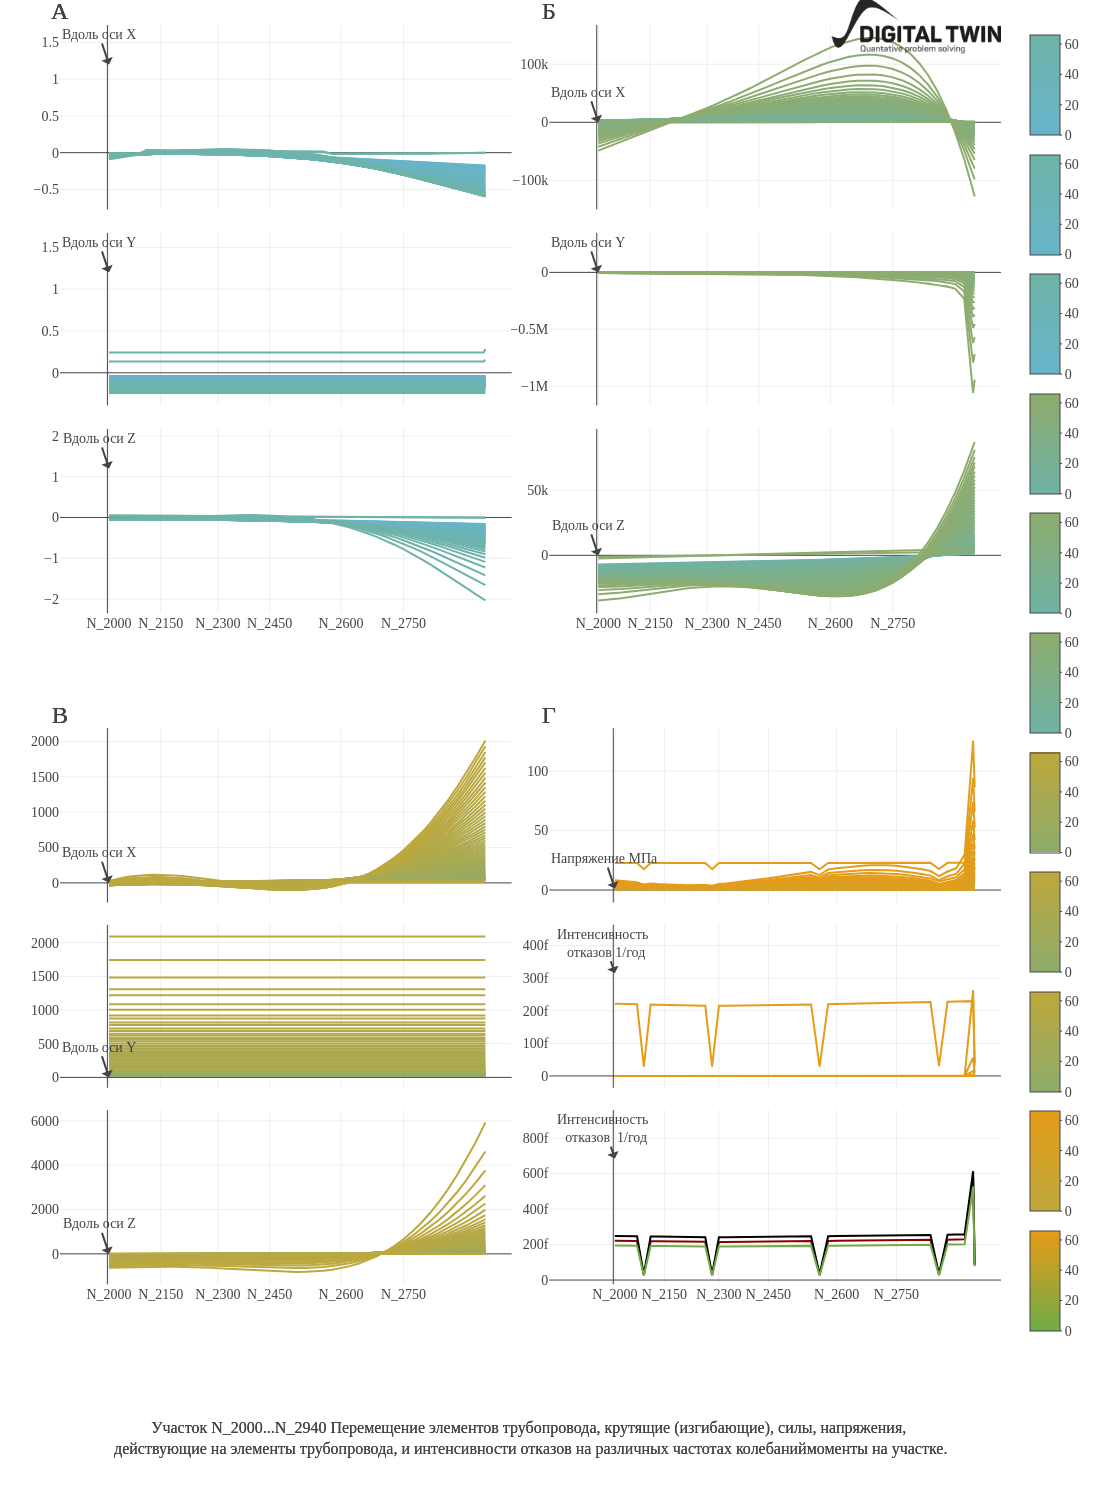
Figure 9 — Residual life projection chart for a pipeline
6.2.5 Report generation
Automatic generation of detailed reports with a 3D model visualization, calculation data, identified hazardous zones, and proposals for optimizing repair work.
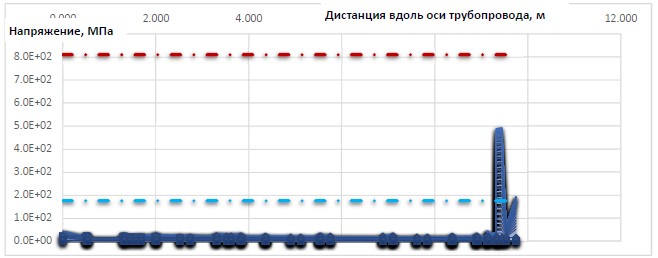
Figure 10 — Example. Acting stresses (dark blue lines), allowable stresses per SNiP codes (light blue dash-dot line), and failure stresses (red dash-dot line)
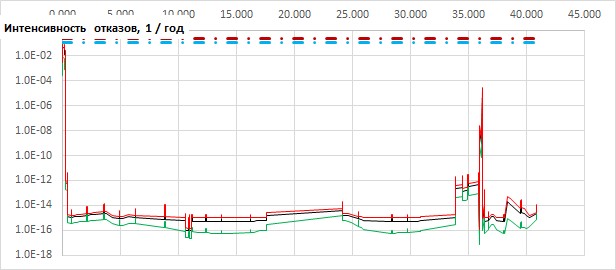
Figure 11 — Example. Distribution of the failure rate (black line) and the 90% corridor bounds (green and red lines) along the section length