Chapter 7 Component architecture
The Pipeline Digital Twin (PDT) platform builds on a set of scientific, methodological, hardware, and software components that together deliver a comprehensive approach to managing pipeline infrastructure.
The component structure links technical documentation and infrasonic diagnostic tools — standalone series A devices and networked series D “Pustynnik” devices with their data-readout software — through a source-data module to two key subsystems: the pipeline digital twin and the leak detection system (LDS). These subsystems produce the final reports, time-domain and spectral metrics, and leak location.
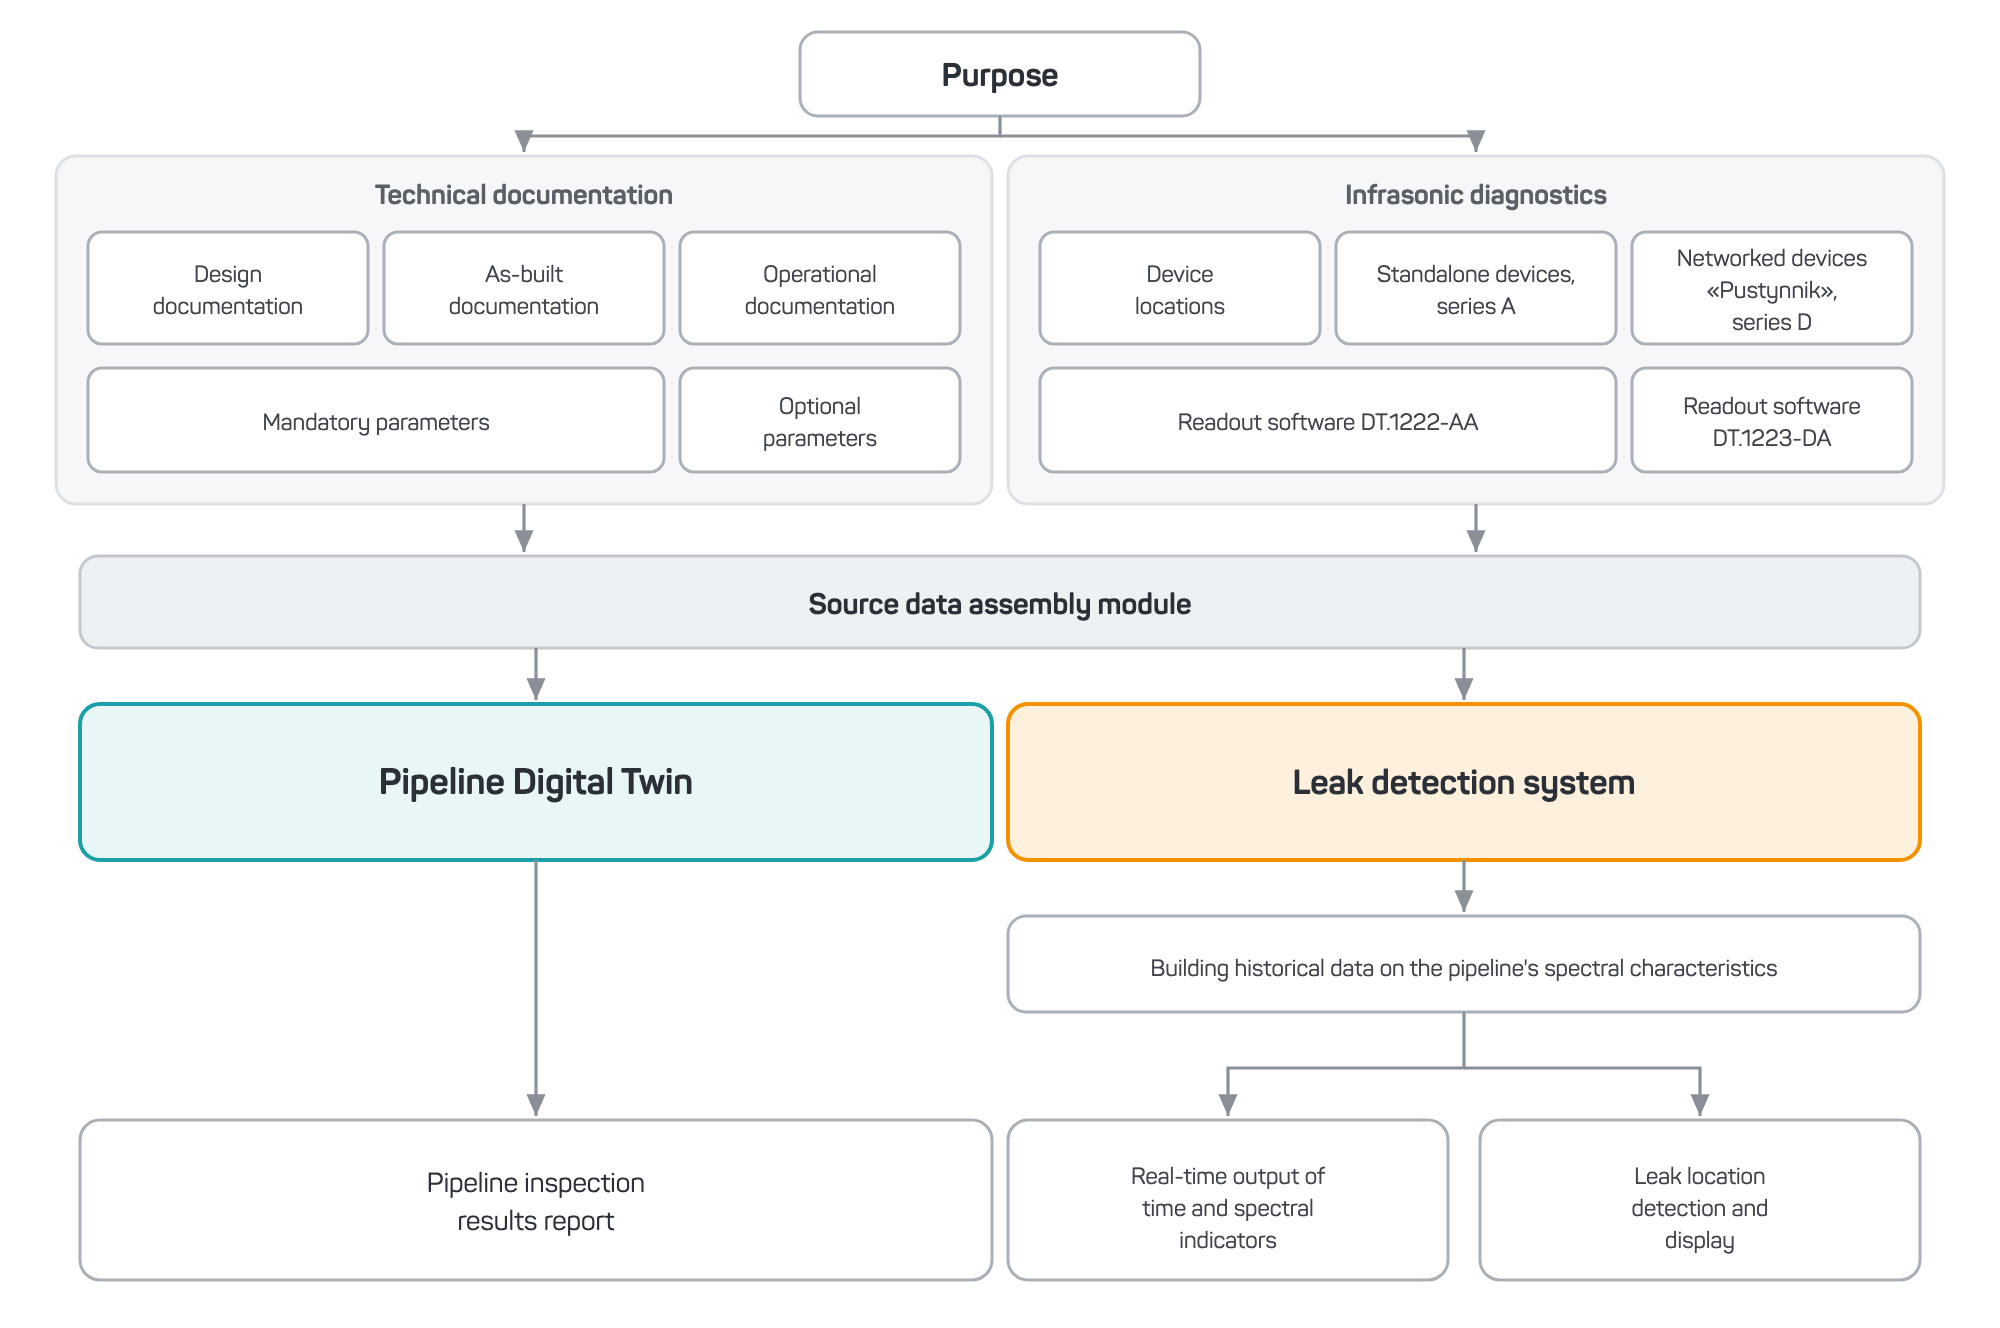
Figure 12 — Component structure of the PDT platform
7.1 Reference data set
This component holds information about structures, materials, load types, defects, aging mechanisms, and diagnostic and repair methods, which ensures the source data for engineering calculations is complete.
7.2 Reverse engineering method
A machine-readable description of pipeline system elements and their relationships lets you build the digital schematic needed to calculate residual life. The method includes:
- recovering geometric parameters from documentation;
- mapping materials and defects to model elements;
- generating spatial coordinates for network elements.
7.3 Infrasonic monitoring technology
The platform uses devices to measure dynamic characteristics — linear and angular accelerations — in both diagnostic and continuous modes, which improves how accurately it detects deviations from the norm.
The devices record:
- linear accelerations along three mutually perpendicular axes;
- angular rotation rates;
- the amplitude-frequency characteristics of vibrations.
7.4 Physical-mathematical life cycle model
This model integrates every factor that affects pipeline performance:
- dynamic loads (oscillations, vibrations);
- static loads (weight, pressure, temperature);
- external conditions (weather, soil, seismic activity);
- damage kinetics and material degradation.
The model accounts for changes in pipeline wall thickness, including those caused by corrosion. The calculations cover both pitting (local) corrosion and uniform (general) corrosion. Even though local defects are small, the model treats them in the context of overall material degradation, which lets you assess their combined effect on the structure’s load-bearing capacity.
7.5 Set of calculation methods
This component evaluates the key parameters of pipeline condition:
- Strength — comparing actual stresses against the limits allowed by the standards;
- Durability — determining the remaining safe service life;
- Reliability — running a probabilistic failure analysis that accounts for stochastic loads;
- Risks — ranking elements by repair priority;
- Costs — analyzing the economics of construction, operation, and repair.
7.6 Software
The software builds digital schematics, runs scenario-based and probabilistic calculations, generates detailed reports, and prepares recommendations for restoring pipelines to proper technical condition.
Key software modules:
- a 3D model builder (drag-and-drop plus tabular import);
- a measurement-data integration module;
- a calculation module (statics plus dynamics);
- a residual life prediction module;
- a report generator;
- a scenario analysis module.