Chapter 4 Platform objectives
The platform tackles a set of objectives tied to moving away from scattered data storage and periodic diagnostics toward a single digital environment for managing the condition of pipeline infrastructure. Within this loop, data, instrument-based monitoring, engineering calculations, forecasting, and decision support all work together as parts of one system.
4.1 Data collection and integration
The platform’s first objective is to build a reliable digital foundation for the calculations and analysis that follow. To do this, it converts design, as-built, and operational information into a structured, machine-readable form and combines it with the results of diagnostic surveys.
At this stage, the platform handles the following sub-objectives:
- Digitize design, as-built, and operational documentation through reverse engineering.
- Convert the source data into a machine-readable digital model.
- Merge data from different diagnostic sources into a single environment.
4.2 Instrument-based monitoring and model calibration
To improve accuracy, the digital model has to rely not only on design parameters but also on real data about how the pipeline behaves in service. Instrument-based monitoring lets us refine the calculation model and tie it to the object’s actual dynamic characteristics.

Figure 3 — Standalone infrasonic monitoring device for measuring a pipeline’s dynamic characteristics
To achieve this, the platform carries out the following:
- Apply infrasonic instrument-based monitoring to measure the pipeline’s dynamic characteristics.
- Enrich the diagnostic model with real data on dynamic loads.
- Treat the pipe structures and their load-bearing foundations as a “measuring instrument” for an integrated condition assessment.
4.3 Modeling and calculation
Working from the collected and calibrated data, the platform builds an engineering model of the pipeline that supports calculations of strength, durability, and residual life. This approach lets us assess the object’s condition not from isolated indicators but through a calculated picture of loads, stresses, and possible degradation zones.
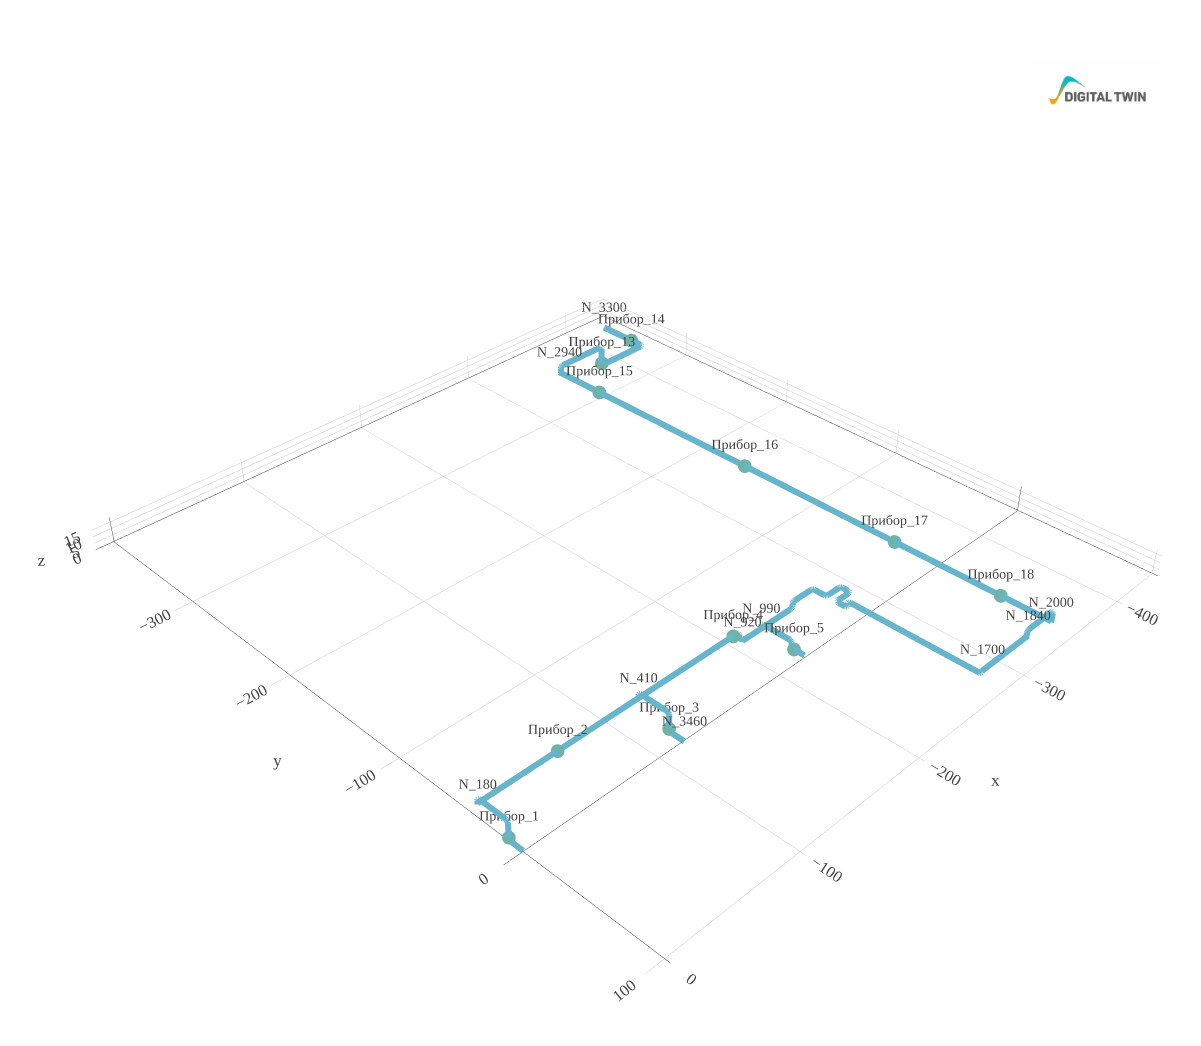
Figure 4 — Digital model of the pipeline
Within the modeling effort, the platform handles the following sub-objectives:
- Build a digital dynamic model of the pipeline’s life cycle.
- Calculate strength, durability, and residual life, accounting for real dynamic loads.
- Determine the stress-strain state at every cross-section.
4.4 Failure forecasting and operations optimization
The calculation model serves not only to assess the current condition but also to forecast how defects develop over time. This lets us move from recording problems that have already appeared to spotting dangerous zones early and planning repair work ahead of time.
In this loop, the platform delivers:
- Analysis of the collected data to identify potentially dangerous zones.
- Forecasts of when and where failures may occur.
- Optimized repair and preventive maintenance programs.
4.5 Building artificial intelligence for operations
The platform’s final objective is to combine data, diagnostics, calculations, and forecasting into an intelligent loop that supports operations. This loop should help technical teams spot risks faster, choose priority actions, and back up management decisions.
To this end, the platform provides:
- Integration of all components into a single intelligent system.
- Automated management decisions based on data analysis and dynamic modeling of pipelines.